Markets spiked upward today right off the open and continued to push higher, while a look at the underlying foundation shows cracks galore.
Gold has hardly rebounded off its move lower yesterday, trading a relatively tight range today, searching for its next move. The odds are still much higher that the next move in the metals is a downward one, coupled with another small surge in the USD to finish off this first leg of the USD mid-term bull market.
The strength of recent rallies is waning fast, as indicated by the new highs on the broader NYSE versus the S&P500 index.
Every time we have seen this particul pattern play out in the past, the subsequent declines have been at least moderate, the most recent one bieing in January and shaving 8% off the index's value in less than 4 weeks. The declines have also been getting larger, just as the divergence and underlying momentum has. Can I say for sure that this one is "the big one"? Absoulely not - the probability was higher in January where the actual price movement was a highly terminal one coinciding with the end of long-term rallies.
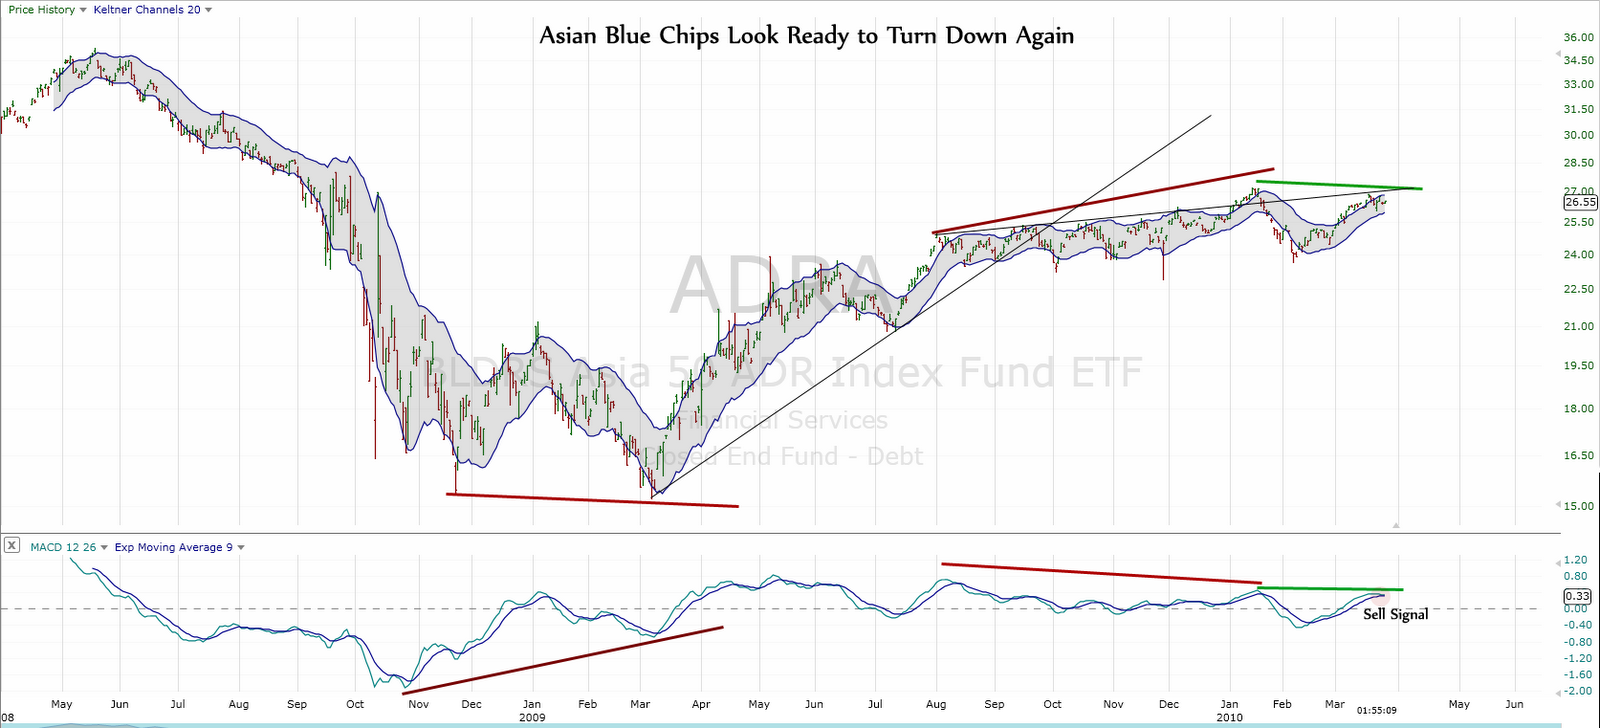
Still, a new low could be made in the broad indexes over the next 2 months, on the back of dollar strength and this next development: China and the majority of asian stocks seem about ready to start another good-sized move down, which could pull much of the world markets along for at least part of the ride with it. China is going to have its own probmes in the very near future (surplus cash or not, anyone who argues that every dollar of the Chinese government's investments are not at least partially malinvested needs to pick up a copy of Human Action by L. von Mises and tell me they agree with that presumption after a historical examination of the success of any form of government spending), with the possibility of a strong deflationary period to correct many economic maladies. This could be a good buying time for the RMB, especially relative to so-called "commodity currencies", many of which are also looking fairly terminal and ready for depreciated optimism relative to the USD.

The US markets are due for either a several percent correction or a longer period of sideways consolidation to build up momentum. We will see what impact the rising dollar (its pull on stocks seems to be minimizing) and falling Asian markets have on North American soil.
Keep your heads up out there.
Derek.
P.S. the CFTC meetings are today and, much to the surprise of many avid gold investors who emailed me over the past few days, gold has not jumped $50.00 in price at the mere thought of short-covering. If restrictions are put in place they will take some time to be enacted, and furthermore, according to historical market psychology, they will be put in around a time that should mark a long-term
bottom in gold prices, and will make an excellent reinforcing indicator to start accumulating larger quantities of physical metal.
END OF DAY UPDATE
Today's rapid push back down in the broad markets form a potential kangaroo-tail point for the markets to reverse down over the next several days. Initial support is at 10,700, with 10,450 - 10,525 acting as an ideal retracement point. There should be one more push upward once this correction is complete, to mark a terminal pattern in the rise from March 2009. However, the impulsiveness and breadth of this decline are extremely important for measuring the mid-term direction of the market, as the commodities, precious metals, and also the Asian markets have turned down and made lower highs.
This is a major non-confirmation when taken in the context of explosive credit growth which led to virtually every market topping at roughly the same time in 2007 (within months) and the CRB index following very shortly afterwards - once they all turned down decisively, the major bulk of the bear market move was underway.
Although it still appears that the bias once this correction is over will be to the upside, we will have more information once it is underway to see whether this is just a small turnback to rattle the bulls, a sideways consolidation to build momentum for another surge, or the start of something bigger to the downside.