Monday, December 6, 2010

Silver's "Double Tap" is a Strong Sell Signal

Silver broke to record highs again today, screaming up to another 30-year peak and above the $30.00 / oz mark.

This is where I am going to take the opportunity to hedge against potential losses in the physical holdings I have accumulated for the past 8 years, as well as a great trade setup.

As of this moment, gold has not confirmed silver's high which is a telling sign of massive exhaustion in this rally.  While gold bugs and silver bugs the world over are sure to be proclaiming "this is it!", there is a backdrop of unfettered optimism towards their "sure gains" that raises the warning flag.

  • A smattering of recent DSI readings on gold and silver above 90%
  • Waning internal momentum on each new push higher
  • Most demand increases for the metals have come from the "investment" (speculative) side of purchases versus more practical and sustainable levels of demand
  • China's recent approval of a sovereign wealth fund to invest specifically in gold and silver ETF's around the world
  • COMEX's reserve requirement hike (similar to 1980 in silver's major top)
There are plent of other factors to consider, including this:

For the uptrend starting in 2001, silver has met this resistance line on 3 previous occassions and suffered declines of at least 30%, and each decline has been larger in percentage terms.  Silver "double-tapped" this resistance line as it shot to new highs two weeks ago.

As a hedge against losses in my physical holdings (I will use the proceeds of this trade to purchase more physical in the future), I am short in the futures market at $29.92.  I have also opened up several options trades on the SLV ETF with April 2011 and June 2011 expirations.

Initial trade target is $20.00 after which I will close out 50% of my futures shorts and 50% of my options plays, and $14.50 or a terminal price pattern after which I will close out the remaining portions.  I will keep you updated on this trade as it plays out.

My stop is at $32.25 pending another small spike for a potential total loss of roughly 7.5%, with upside potential of 32%.

Best of luck out there.

Derek.

Tuesday, November 9, 2010

Telling Bar Patterns and Record Volume

This is going to be a quick post.  Silver is in a blow-off top stage, as mentioned in my previous post, and in commodities these are generally spectacular, immensly participated in, and that the subsequent crash is usually at least as breath-taking as the run-up preceding it.

Gold, Silver, and the HUI all had daily reversal bars today - quite a feat considering all 3 popped to significantly higher record highs right off the open.


Silver was an interesting case, holding on to more of its gains than its more valuable cousin.  That being said, the intraday trading range for silver was around $3.00 / oz, and the SLV ETF volume was a record-shattering 148.42 million shares traded on the day, just under $4 billion (this is equivocal to about 150 million ounces of silver, roughly 1/6 of the average worldwide yearly silver production for the past decade.  In a single day.)  The past two trading days on the SLV have ousted every weekly volume record for the ETF since its inception.  This appears to be a week to remember for silver.

A closer look at the intraday action reveals that, besides the overall wave of volume, the behavior was that of distribution and very strongly.  Volume spiked with each reversal and waned swiftly as the ETF attempted to regain lost ground.

Is this (finally) the start of the major decline in silver I have been calling for?  Right now, it is extremely difficult to tell - probabilistically silver is due for at least a significant correction, and it should find itself back within the confines of the channel, at a bare minimum, if it is to try another rush into a blow-off yet again.  If this is the start of the larger, more protracted decline, then silver should swiftly plummet below the $20.00 / oz mark and smash through a few significant support levels.


To further solidify the position of at least a near-term trend change, on final intraday correction and push lower is required tomorrow before an upward move of 1-2 days would take place.  If silver immediately turns in the morning and attempts a thrust upward, a break of  $26.96 on the SLV (27.81 COMEX futures spot) would indicate another rapid thrust higher to finish off the move.


If you are long gold stocks, silver stocks, or anything in the "paper" arena of precious metals investing, be extremely careful.  The volatility experienced in these markets was vastly more intense than that in the rest of the North American stock markets, and could be a precursor of things to come in the very near future.

Have a great week!

Derek.

P.S. - A quick afterthough of some significance:  It appears, judging by the last several days of behavior, that the US Dollar has finally put in its low against the Euro and is quickly starting the largest part of its multi-year rally that began in 2008.  Forex traders long EUR be wary.

I am anticipating this pullback in stocks to accompany a run-up in the dollar, and then the final peak in the broad US indexes to accompany a higher low in the USD within 1-3 months, whereby markets will jive back up and start moving more in tandem.  I will post some chart hypotheses on this in the near future.

Wednesday, November 3, 2010

What people DO.....

True believers in a massive deflationary wave are few and far between.  In fact, among professional analysts and more "renowned" forecasters, you can count the number of real deflationists on one hand - maybe two if you stretch things.

The large majority of forecasters, and more importantly the investors who listen to them, are predicting inflation.  Hyperinflation is a fairly common term these days, one can hear it frequently by flipping on a major financial station.

However, talk is talk and talk is cheap.  It requires no investment other than a few breaths or clicks on a keyboard.  The place to watch is where people are moving their money.

I have mentioned in this space before about the fallacies of "efficient market theory" and also about "market manipulation" (one of the most commonly used excuses by traders and investors alike for why they lose money).  The market is a singularly interesting composite of activity - millions of people gather together every day with their excess (or not so excess) capital to find a place to compound it.  They do so via a foggy window, in that the information on what they are buying is extremely limited and the things they are buying are intangible. With such a limited amount of information, people naturally revert to the same mechanism that most do when seeking safety or advantage in physical life - they follow what other people are doing.

Most investors and traders are not aware of this phenomenon.  It is a totally natural impulse, the same type of impulse that organically makes humans form lines or walking-lanes in busy foot-traffic.  This is why such a small percentage of traders can be successful over the long term.  Objectivism and discipline are two keys to successful trading.

But I'm not here to talk about successful trading in the aggregate.  I've found a few interesting tidbits that I believe might be setting up the market for its next wave down (and in response to the market downturn, the next serious bout of monetary deflation - right in time for "QE2").

For the first time in 6 months, net inflows into US Equity markets were positive for two weeks in a row.  US Equity markets took in just under $2.8 BIllion dollars last week.  This is the first time two consecutive positive inflows have occurred since, you guessed it, just prior to the April 26 market top.  That in and of itself is not a damning piece of data for market behavior, however within the context of the past several months it is very pertinent.

The story of municipal, regional, and corporate high-yield debt continues to play out and is, quite simply, a ticking time bomb.  Since markets are still yielding a very bearish low dividend in a historical context, investors have been flocking to Junk Debt in order to start getting some kind of return on their money.  The obsession with yield and the flagrant disregard for the security of their principal investment shows that the underlying acceptance for highly-speculative "investments" is still engrained in the mind of the average investor.


Bond Up/Downgrades are at a bearish extreme seen only just prior to the Dow:Gold peak before the turn of the century.

Sentiment measures are extremely one-sided across all markets.  90%+ Bullish readings on the short and long term DSI are spread across commodities like Gold, Silver, Copper, Sugar, Cotton, currencies like the Euro, all 3 US Equity markets, US Treasury bonds, etc.

Meanwhile the US Dollar's DSI is flailing to stay above 10%, and has experienced one of the longest periods on record with a DSI reading below 15%.  Internals on each subsequent high in stocks, bonds, speculative currencies, commodites, et al are weakening at each new wheeze higher.

All markets are lined up as a massive one-sided trade.  Double-speak on commodities runs rampant, including things like "x will go up if the economy improves because people use it more and demand will increase." and "x will go up if there is a depression because people run to it as a safe-haven".  There is a host of reasons people cite.  The most popular reasons generally encountered are:

  • Inflation - ' "money printing" by central banks will cause the price of commodities to go up.' - Ignoring the fact that in a wave of pessimism no amount of QE, or whatever label people like to put on it, will change the fact of total monetary contraction, this is one of the most commonly cited reasons for commodities' (especially precious metals) perpetual rise in price
  • Central Banks are Buying Gold - central bank buying increases demand and therefore drives up prices.
  • Investment Demand - while investment demand has certainly increased, this demand is speculative - Buying for the sake of investment is buying with the expectation that someone else will be willing to pay you more for what you purchased at a later time.  Since the price-demand curve of finance is the mirror opposite of the tangible economic world, this does not bode well for future participation.
  • The "Mania" Stage is not here yet (Mostly cited for Gold) - The expectation of average investors and even those newly entering the gold market is that at some point in the not-too-distant future flocks of thus-far-non-participants in gold's 9 consecutive annual up-closes will drive gold into the stratosphere.  While this may or not be the case, the one-sided expectation that there will in fact be a gold mania, just as there was a tech-stocks mania, a real estate mania, a commodities mania, etc. is generally a precursor to something drastic happening that is the mirror opposite.
Inflation fears are so rampant right now that TIPS Treasuries actually traded up to a negative yield recently - this means that people are so worried about protecting their cash against future losses via inflation that they are willing to pay a small percentage just to insure against that chance.  With the DSI on Treasuries hitting 98% recently, they are one of the ripest short opportunities on the market.  What people are DOING is raising a massive red flag to me that expectations on inflation are in the red zone, meaning the probability of seeing $5000.00 gold in the near future is extremely slim.

 Gold appears to have put in its major top, although with the non-confirmation of silver being erased after 2 weeks we could see yet another stab upward above the upper channel line on both metals.  It's movement patterns thus far suggest it is the first asset to have topped out and should soon be followed by a plethora of others.  I have not accumulated any physical metal since gold was below $900 and silver below $12.00 and I will not be purchasing any more until they are well on the way into their downtrends.

As for stocks, there are quite a few good shorts out there now.  Some of the "Darlings" of the recent rally, including Amazon and Google are extremely overvalued and have seen hugely optimistic readings for the past 2 months.  The entire market is elevated and stretched and barely wheezing along.  If I see a definitive turning patter play out I will post it as soon as I can.

I apologize for the lack of updates for the past 6 months.  I have been doing a lot of consulting work on the side lately and only made a few multi-week swing trades in the interim outside of my core positions (Long USD/short Euro and short US Treasuries long term via Put Options.)  I'll try to pick up the volume of my posts through winter as the markets become more volatile.

I hope all my readers are doing well.

Derek.

Monday, August 30, 2010

The Treasury "Bubble"

A huge majority of investment "experts" and pundits watching the action unfold in the treasury markets have been treating the recent upswing in prices as its own little corner in the big picture.  Investors and advisors alike regard treasuries as relatively insulated from the rest of the markets, or at best correlated in an inverse manner.

However, when I look at treasury bonds, all I see is a tiny piece of a much larger puzzle.  Seeing the forest for the trees, as it were.  That forest is the debt saga that has grown and bloated and expanded for over 70 years, resulting in the largest financial bubble ever to grace mankind's irrational nature.

The treasury market is more like a stop in the game of hot-potato.  Investors, fund managers, pension funds, et al, are trying to find a safe place to park their cash and make some money from it.  From securitized consumer debt to corporate bonds to munis to regionals to treasuries.  The hot potato gets passed along.

Municipal bonds are a disaster waiting to happen.  This has been well-documented by some very astute observers and I won't touch on it now.  Everyone and their uncle already knows the story with securitized consumer debt - that's been old news since 2007.  State bonds are starting to become highly questionable - some states, like California, have a higher probability of default than Portugal.  Foreign sovereign debt prices have been dropping consistently as sentiment towards debt once again resumes it pessimistic shift.

The last domino to fall, then, is Treasury Bonds.

Long-lauded as a safe haven, due to the state's ability to use its monopoly on violence to gain funds and its political ties to the printing press, Treasury bonds have had quite the run of late.  Virtually no one is bearish on this final domino in the debt bubble (98% bulls registered on the DSI last week).  While we could see a pop in bond prices, this move is exhausted and near its end.

I have written before about how a deflationary environment can still drive up yields as the probability of debt repayment drops drastically with the contstriction in available free cash.  This should be the reality of the situation over the coming years.

The moral of this story is:  Treasuries aren't in a bubble - debt is in a bubble.  Treasuries are just another name for the same thing - someone taking on an obligation they cannot repay.  We are unwinding several generations of positive sentiment that morphed into a mania - this is not a slow and easy process. 

And a classic pattern to end the move in a classic "safe haven":


As you can see, this is not a pretty picture for long term Treasury holders.  The coming move is going to take millions of investors, pension funds, traders, etc. by surprise. 

As such, my recommendation is this:  Short Treasury Bonds - the longer term the bonds you can short, the better the results will be.

Have a great week!

Derek.

Wednesday, August 11, 2010

Update for August 11, 2010 - The Breakdown

In my last forecast I wrote that the highest probability was that the Dow would push to new highs before rolling over.  The ideal scenario called for a burst above the rising trend line followed by a quick reversal, which would kick-start a resumption of the larger-degree bear trend.

While the upper trend line was still over 80 points from being breached, the market behavior still met the psychological criteria - a sharp drop on Aug 6th, followed by a solid upward swing that sucked a large number of players in who had watched the same thing happen to smaller degrees the previous few trading days.

This was followed by an immediate reversal, with 2 trading hours wiping out the previou 7 1/2 of hard-wrought gains.  Today's 250+ point hammer-down in the Dow, with the market barely able to pick itself up at all during the whole trading session, indicates that there is a high probability the game has changed, and we have reversed trend.

To add strength to this thesis, the USD put in 3 up-days, with today being an extremely strong move, wiping out the previous 9 trading days of losses.  These moves are sharp, scary, and leave financial analysts scratching their heads as the only news has been the Fed's return to QE and moderate caution regarding the economy - but shouldn't, according to faulty cause-effect market models, QE mean that stocks will go up?  Stocks rise when money is free, right?  Inflationists are hopping about, saying "this is gold's ticket to the stars", and "inflation, inflation, here we come!".  And yet.....


M3 is currently contracting at its fastest pace since the 1930's

This is actually a huge fallacy as history will show that, more often than not, stocks rise as interest rates climb - but that is a study for another time.  Here is the market update for August 11, 2010:


This is a weekly chart of the Dow running to today's close.  Notice that the April high was an almost perfect .618 retracement of the entire first bear leg from Oct 2007 to March 2009.


This hourly bar shows that the Dow has decisively broken down from the bearish rising wedge pattern.  Momentum continuously slowed and, while hype and "phew, it's over" became more prevalent, this market rolled over and has caught most by surprise.

Notice that this current correction, the same bearish sequence as the one showed above on the weekly Dow chart - although two degrees smaller - retraced to only 10 points above the .618 before rolling over.  An ideal retracement target, this leaves huge bearish potential for the next several months, and we should see the Dow take a haircut of at least 2,500 points.


Further techincal evidence for a change in trend is a weekly reversal bar, which today's downswing has formed.  Even if the market manages to eke out a 200 point rally from this point through Friday's close, the bar is intact.  It will take a huge burst of bullish activity to erase the potential for a bearish turning point, something for which the odds are fairly low.

The only other reversal bar, either bearish or bullish, in the past 18 months is the April 2010 market top - the Dow subsequently lost 1600 points.  Since this stage is the "majority in" part of the move, whereby the majority is on with the trend, we should see a larger loss in percentage and point terms.


Gold, since I forecasted a top in late November, is virtually net sideways from that point.  Gold should begin to roll over more quickly with the rest of "risk assets".  I will be watching it closely.  The nonconfirmation between Gold and Silver going back to March 2008 (and even further back to 1980) still stands, and gives weight to the bearish case for both metals.

Momentum has continued to wane just as hype and general acceptance has grown.  The recent high in gold saw similar participation on the futures to the March 2008 high.  A decline of similar or even slightly greater magnitude is in the works and should provide gold bugs who aren't too disenchanted the chance to pick up the metal much much cheaper.

Our oil trade still stands, and it appears that oil is rolling over into a larger stage of decline.  This should take oil somewhere into the $50.00's per barrel and possibly even lower.  Our final target for oil is below the fall 2008 low.


Best of luck.  If I don't get to doing an update before the weekend, enjoy it!  Get outside and take advantage of the summer - only 5 weeks left until fall arrives.

Derek.

Friday, August 6, 2010

3 Charts and a Happy Friday!

I just have 3 charts today, all of the Dow Jones Industrials.  Just a snapshot of where we are in history.  My position on other assets (gold, silver, USD, oil, etc) remains the same;  We are either in the earlier stages of a major decline (silver, gold, oil), or starting major trend turning points, both bearish and bullish (Dow, S&P500, $USD, Euro).


Something to contemplate.  Have a great weekend everyone!

Derek.

Thursday, July 29, 2010

Did the Market's Corrective Pattern Top Out Today?

I have been warning investors for many months now that this market is going to suck in the maximum amount of long participants before beginning its larger-scale decline.

Today's gap-up from the open was a very high probability exhaustion-gap which carried the Dow to a new intraday recovery high.  From that point on, prices started falling immediately and the movements look extremely impulsive.  This indicates that a new trend has developed.  Chances are, the correction going all the way back to June 8 is complete, leaving huge potential for downside all the way into Dow 8,000.


Gold, silver, and the stock market have been moving in a high-correlation lately, and with gold's turn down from all-time highs to rapidly break down from its rising trendline, it appears likely that a minimum target of $1000.00 / oz gold could be met sometime this fall.  Silver's initial target is $14.00 / oz with larger bearish potential as time goes on.

Another fantastic trading opportunity is in oil, which we recommended a short position on several months ago at $86.00 / bbl - Crude's downside potential is into the $50.00 / bbl range which makes this an extremely high-profit short potential.


The Bottom Line:  Virtually ALL asset classes without exception should decline in tandem as the next phase in the credit contraction gets rolling.  The USD also appears to be either just completing its multi-week correction or within days of doing so.  Once this trend reverses watch out.  Gold and silver are not an exception to this rule and they should decline in tandem with stocks, commercial paper, and other commodities.

While central banks around the world have beent trying, and will continue to try, to pump liquidity into the system and inflate credit markets, this activity has exhausted all their ammo and will soon exhaust their credibility.  This is a positive for the future as massive deflation will destroy many "wise" central bank balance sheets - these cartels have left themselves exposed 100% to current market forces and foregone the usual safe-falls.

The question might just be:  Who will bail out the Fed? 

The coming market behaviors will be one for the history books.  Make sure you have your cash safe (keep a significant reserve OUT of banks), and for investments are purchasing the safest cash equivalents in USDs.  When there is actually a real chance of inflation you will read about it here and the investment strategy will change to ensure that purchasing power is retained.  Until then, deflation is the name of the game and many will be taken by total surprise.

Make sure you aren't one of them.

Have a great week, and enjoy the summer days.

Derek Blain.

Tuesday, May 11, 2010

Opportunity: Made?

In my last article I covered one of the companies directly involved in the oil spill, and suggested that more downside was coming.  This, I also asserted, would be partially affected by a slide in the price of oil.

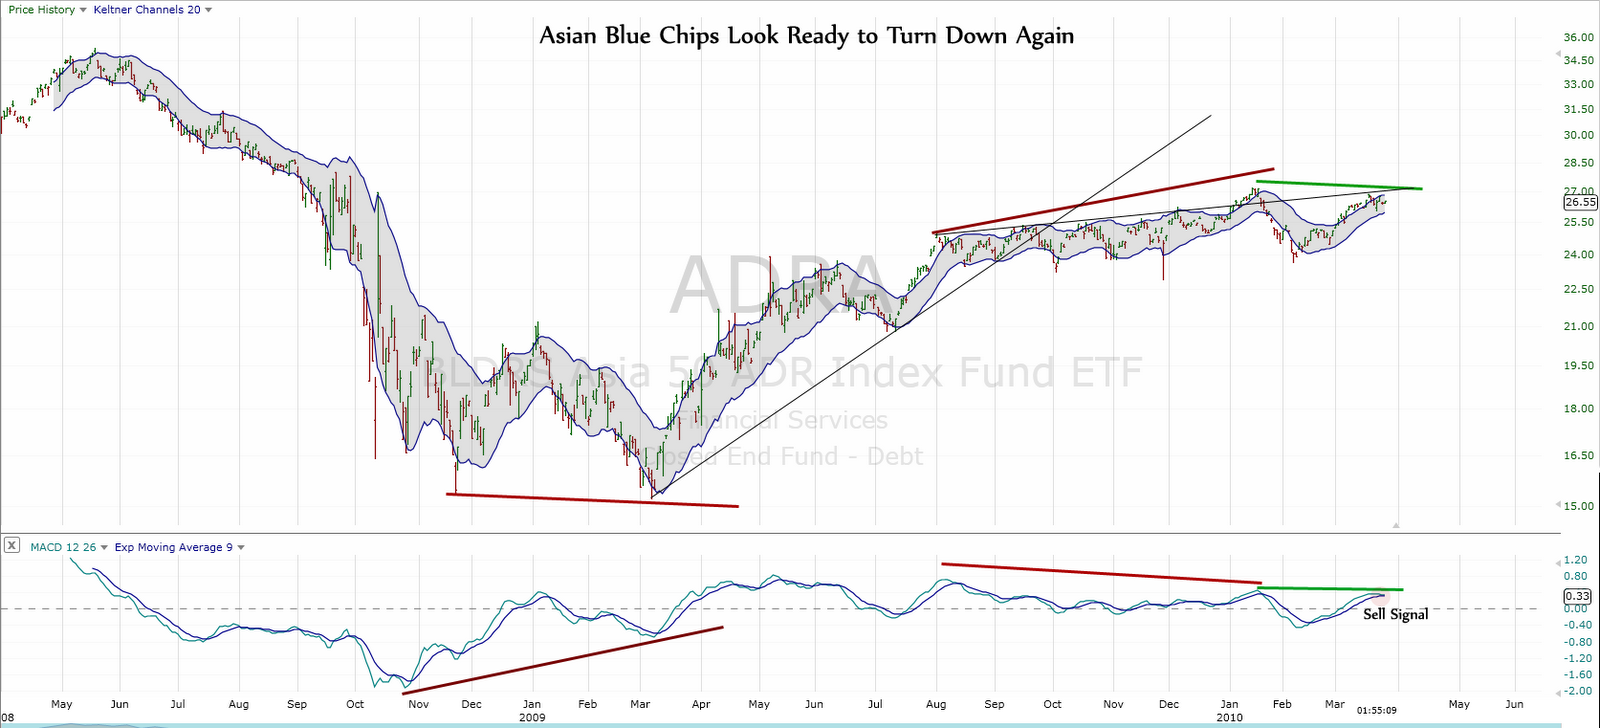
That was on April 29.  Since then, we have seen a significant correction in stock markets the world over.  Furthermore, since pointing out that (despite being the "darling" of the world in economic terms) Asian markets were getting ready to roll over once again, they have done just that.  Shanghai's market has now surpassed the 20% drop point from its market high, putting it into a technical bear market.  On April 28 I posted that another drop in the broad US markets was also coming - at the time, I didn't foresee a 1,000 point candle.  However I have written in the past that during this next major leg down parts of it will be so furious that it might be unwise to be a participant at all - what's the point of being short if you can't close out your position?  We saw erratic and erroneous behavior on several tickers last Thursday, including transaction prints running 25% in or out of the money as the entire side of a Level 2 was blown away.

A slew of emails in my inbox since Friday have continually asked the question "was the 1000 point drop in the markets a computer glitch?", or something along those lines.  In short, no - it was not.  In fact, the reaction to such a drop begs the question in regards to financial assets as a whole;  If a massive drop on last Thursday was immediately disredited as a "glitch" in computer trading, then why was a 14-month record gain posted yesterday accepted with smiles and gratitude?


Oil has suffered a quick haircut since I posted my turning point on April 29, down 12% - along with it, RIG continued its slide by another $10.00/share.  While the US Government may place a moratorium mid-term on offshore drilling to appease the beating these companies will take, offshore drilling is going to be one of the cornerstones of world energy for decades to come and RIG will be there to profit from it.  (For an Austrian Economics perspective, and one that I certainly share in regard to this incident, I encourage you to read this excellent article by Murray Rothbard)

I am not buying shares yet, but they are looking more appealing than they were 3 weeks ago (down 24%).  Our other recommendation, STD hit our Wave 3 target of the low $9.00's and has surged up to just under maximum retracement - any break of $12.36 indicates the mid-term downtrend is over and a bullish run is to be expected.  Our stop is set just above this point, with our closing target still set at below $4.87/share


GOLD AND SILVER

Gold has broken its all-time high today, negating the current bearish forecast I have been working with since late last year.  Despite this, at least a minor correction is to be expected with the current DSI levels reading 95% - pretty much every one who can get on one side of the trade is there, and this usually marks an ideal turning point in gold.

Despite that, one must not forget our investment philosophy at Investophoria.com - be safe with the money you cannot afford to lose, and take high-probability opportunities with smart money-management and well-defined stops with the money you can.

Precious metals are what we recommend for savings, not for "investment" - this point has been covered in detail for ages.  On many occassions readers have asked, both via email and through public posts, whether they should buy gold and silver - my first response is always:  Do you own any yet?

Whether gold goes to $1500 or $600, you should have some on hand;  It's real money.  The same goes for silver.  

So, with gold's break my forecast for much lower gold seems to have been negated (for a while), and the pathway is clear to up to $1325 gold.  That's not saying that we'll get there, and that bieng long right now is even close to a safe bet, but optimistic extremes can carry to head-scratching heights, and gold may well just be the last domono to fall.  A downward correction at this point would be healthy as sentiment is very elevated towards precious metals.  I will keep a close eye on price activity to see if better targets for upside and downside time and price can be established.


One thing to keep in mind, which still lends to silver's bearish case, is that the stab up to the top of the trendline has finally been put in - this completes an almost ideal ending pattern for an uptrend, and offers a high-probability that it will turn very soon.


Whether or not it is believable today, deflation is on its way, and will rear its head soon - even the skyrocketing bond-yields on government debt are deflationary in the short term - more capital will have to be diverted away from private sources and to government just to service debt, and defaults will take swaths of "wealth" from balance sheets the world over (upon which more debt has most likely been taken out for speculation, in many instances).

With gold's break to a record high, it just goes to show that (because of one of the most commonly cited reasons for gold ownership) everyone is betting on inflation, and lots of it.  And when everyone is betting on one side of the trade, it is not necessarily the safest place to be.

As always, if you have questions, concerns, ideas, or just a friendly (or unfriendly) hello to say, you can email me at:  Derek@Investophoria.com

Derek.

P.S. I apologize for my absenteeism over the past couple of months.  I have been very busy out and about for much of my days and as such will be posting evening articles over the next few weeks.

Thursday, April 29, 2010

An Opportunity in the Making?

Any hard asset investor can hardly call themselves such if they don't have at least one oil stock in their portfolio (this, despite the fact it's gooey, slippery, and definitely not hard).  I recommended some oil companies in late 2008 and early 2009 which were extremely profitable.

However I am looking at another potential setup in the fairly near future (anywhere from a few weeks to several months).  Something to keep in mind, anyway.

The sentiment towards oil itself has been gaining strength, with speculators holding a huge number of open long contracts the past several months - the past few weeks have been holding steady at well over 110,000 open long contracts.


While looking at only the number of open contracts aside from anything else is not a great idea for trading oil, it is a nice piece of data to show where overall sentiment is sitting.  As of right now, it's pretty elevated - I'm not saying we won't see another surge up in oil, but upside in the immediate future should be fairly limited.

The particular stock I'm looking at isn't an obscure name by any means (they are the biggest in their industry), and they have been tossed around for years now by major publications.  That being said, most of these guys were recommending the stock before it took a 75% hair cut along with the market.  It is still under 50% of what it was at the oil peak in 2008.

The company is on the higher end of fairly-valued right now, but fairly valued nonetheless.  As of today, it trades at under 9x Price/Earnings, 1.33 Times its Book Value, and 2.36 x Gross Revenue.

Cash-flow is fairly strong, with a 4x net interest coverage on all outstanding debt from free cash.  The company has retired a large chunk of its debt over the past 2 years (over $5 Billion), and seen 2 years of revenues above $10 Billion (from $2.8B, $3.9B, and $6.4B in 2005, 2006, and 2007, respectively.).

All in all, revenues are up, the cash position is strong, assets are generating tons of cash, and demand for the product they offer is growing steadily with growth potential reaching far out into the future.

The company is one I'm sure you've heard of before.  Transocean (RIG on the NYSE), headquartered in Switzerland (for tax purposes), and with the largest fleet of underwater drilling ships on the planet. 

This is not an easily entered industry - It is extremely capital-intensive ($500 + Million to build a drilling ship), which offers an excellent natural barrier to entry against a wave of new entrants/competitors.  Furthermore, the type of clients that Transocean deals with aren't fly-by-nighters or small-time companies where taking their business may be a bet on receiving payment.  Transocean's customers include Chevron, Exxon, and many of the other big players exploring and tapping underwater reserves - Most of these guys have stockpiled tons of cash over the years and are hungry for new projects to keep revenues up as older project output dwindles.

From the technical side, it doesn't look like the stock has a high-potential for further upside in the immediate future.  As far as sentiment tops go, the recent major push by the Obama administration encouraging underwater drilling is a re-enforcing signal of an interim top in positive psychology.  As sad as it is to say, the oil spill in the gulf of Mexico is as fitting an occurrence as could be in the wake of that sentiment (remember, the State is always a late-comer).


This should provide a mid-term negative backdrop for the stock to settle into a more opportune price-level and make a great addition to a long-term core portfolio.


I'll keep you updated on this pick and let you know when I'm going to scoop up some shares.  At this point, the stock looks to be building for a major move with downside potential being far greater.  That being said, key resistance is at $93.25/share, and a daily close above that mark would indicate a major bullish breakout potential in the immediate future.

Have a great weekend everybody!  As always, if you have any questions or comments you'd like to send me directly instead of posting on the blog, I can be reached at derek@investophoria.com

Derek.

Wednesday, April 28, 2010

A Minor Top Is Nigh

The Greek "crisis" continues to unfold almost uniformly to our expectations, and its ramifications for the EU as a whole are certainly not painting a rosy picture for the coming decades.

The first order of business is to deal with the still-open STD short.  I picked this bank back in December because it was a mirror of the overall psychology toward the finances of Greece itself, being a mammoth-sized financial institution (relative to Greece's overall economy).  Many readers sent emails and posted comments doubting this choice, and even the severity of the debt crisis that is unfolding.

This debt crisis is not a Greek, PIGS, or Euro problems alone - the entire world is going to soon enter another deflationary cycle after this reflationary pause is complete.  I don't feel there is much time left ticking on the reflation clock.  The market has ridden to exceptional highs, over 7.75% higher than our ideal retracement target of 1132 on the S&P500 (at its recent highest peak).  A very respectable opportunity to close out open long positions is at hand, and I suggest taking advantage of it with at least a large chunk of the core funds you don't want to put at unnecessary risk.

Today's break of recent key support opens the path for another sizable drop in Greek bank stocks, and further tensions in the EU


As for the broad markets as a whole, they are far overdue for at least a minor correction to shake off the extremes in positive sentiment we are seeing today and pull some more chasers into another small leg up.

An ideal retracement point on the Dow is around 10,800 before another leg up.  That being said, most are expecting at least another leg up, so there is a chance that a more major top is in the could erase 1/3 or more of the rally since March '09.

Speaking of Sentiment Extremes:


The credit contraction continues as M3's negative move accelerates even further.


As for the broad markets themselves, some small nonconfirmations of momentum and price could be indicating that larger move down.  Coupled with sentiment levels this is not a healthy stock market to be long in for the short term.  Once a small correction has occurred we will re-assess the situation and see where we can expect another minor leg up or more downside.  If the next day brings an immediate push down, the case for further downside is strengthened as this weeks bar would be a reversal bar (


The precious metals run-up seems to be drawing to an end.  The HUI hit the Fibonacci .618 retracement of the first larger down-move from December 2009.  It could not maintain a close above, and turned down in the last hour.   The initial ideal target has been met to mark the correction complete, however one final push up and a new high in 4 days would mark it complete in price target range and time as well.

One further piece of evidence that this move is corrective and not part of a larger trend up is that the slope of the move up is only 54% as strong as the down-move that preceded it.  The impulsive move ahead still seems to be more probably to the downside, and a significant one at that.


The non-confirmation between gold and silver should rectify itself with silver pushing to another final high.  The minimum corrective target at this point is $18.18 with further potential up to $19.00 and slightly above.  If this scenario plays out silver should immediately reverse and rapidly approach a new low for the move below $14.50 / oz


Have a great Thursday and Friday, and enjoy your weekend!

Derek Blain

P.S. Comments or Questions?  Email me at derek@investophoria.com

Monday, April 19, 2010

How Do You Measure A Paradigm Shift?

For the record, this is not a recession.  This is not even a very harsh recession.

What we are currently smack, settled, and complacently in the middle of is a Depression.  A rare, multi-generatonal economic "phenomena" that takes the vast majority of the population by surprise.

A depression is not the type of situation where supply has outpaced demand growth (due to minor levels of malinvestment, generally due to the meddling of money supply and interest rates), where the heat needs to settle in and the shelves need to clear some space before growth can resume.

A depression is where capital has gotten so out of whack with natural market forces that much of it needs to be put on fire-sale and fast. This isn't a run-of-the-mill recession where the government puts on the appearance of "fighting" it, and "providing jobs" that seems to work enough for the non-economically educated to give them some credence.  A depression is where generations of "help" from the government and easy money and credit have finally misallocated such a vast amount of resources and capital that the whole thing just sort of gives.

It would stand to reason that since this literal era of misallocation and malinvestment we have concluded took more than a few years (decades, is more like it) to play out, it would take more than one or two years to even partially correct itself.  Especially since it involves something humans seem to fight against tooth and nail.  Change - lots of it.

This massive misallocation of resources happens to include, in part, the attitude and ownership of financial assets in general.  Therefore, the following might be a hint of the future.


One thing I have been forecasting for several years is that the overall allocation of resources into financial assets will decrease sharply in years to come, especially measured against actual capital and tangible production.  There are still swaths of debt instruments that will be declared worthless or "unmarketable" as time progresses, and many other assets worth far more than their real value.  Migrating cash from these sketchier plays (where everyone seems to be going, to get the "yield" compared with high-quality debt) into something safer is certainly one of the smarter things that an investor could do.

Things are lining up for a major market top within the next few months and the coming downturn should put a more realistic perspective on a lot of things that everyone is "hoping" have somehow worked themselves out.

Have a great week!

Derek.

Friday, April 16, 2010

The Start of Something [A LIttle] Bigger?

Today should mark the start of a more significant decline in the broad stock markts that should erase 1/3 to 2/3 of the rally up from Feb 5, before making a final leg up to complete the larger degree bear market rally from March 2009.


As I have discussed many times before, the "hope" mentality of previous major market tops will be no less apparent in this move - It will usher in the next major leg down in stocks and other assets.  To underscore that thought, I re-iterate that deflation is the far more worrisome (in terms of real likelihood) scenario in the not-too-distant future, despite CNBC's latest batch of yammering stock-monkeys carrying on about inflation every single day.

The ratio of surveyed bears on the Investor's Intelligence Survey is extremely low (<20%), a rate that generally coincicedes with at least minor market tops.


Another major bearish indicator is the put/call volume ratio, which plummeted to an astronomically low 0.50.  Investors are betting in a huge way on future continuation of a major bull market - they will be sorely dissapointed as this minor correction and final leg-up sucks in as many committed players as possible.


Silver appears to be definitively in a long-term bear market at this point than gold, and has at least one major leg down in price ahead that should take it well below $14.00 - My longer-term target for my favorite metal is still below $8.00.


A break down from this wedge formation and a close below the $16.30 mark will indicate that the next large bear move in silver is underway.

Stay sharp out there!  Today's drop took many committed investors and traders by surprise and should continue to do so for at least a few weeks.

Derek.

Wednesday, April 7, 2010

Market Overview

The Dow appears to have completed an impulsive advance, and should enter into an ABC correction knocking at least a few hundred points off and resetting the momentum and strength indicators to make way for another upward push.


The USD still appears to be in the early stages of an ABC correction of its own that should take it below the 79.00 mark on the index.  Gold and silver have still not rallied to a point where they rescind the bearish forecasts, however the break fo initial support lends more weight to the "shallower correction" theory and subsequent major leg-up to follow. 


Update:  Tuesday, April 13.

There is not much to add by way of new developments - markets continue to struggle higher on anemic volume and more anemic momentum indicators.

Silver's DSI reading is over 85% showing a major bullish bias to the white metal - while this ratio can hold over 90% for some time, extremely one-sided opinions on any asset can lead to swift and sharp corrections. 

The market is still due for a larger pullback which should erase at least 1/3 of its recent rally for the past 2 months.  Following that we should see another higher-high in the US markets which should mark a completed terminal pattern - I will be looking to various sentiment and momentum indicators as well as secondary indices for verification along the way to see where we are in the bigger picture.

Despite the markets up-day, the VIX was up 4% on the day, indicating a shaky psychological foundation for further rises.  Yesterday's gap-down could be an exhaustion gap on the VIX, and the index should turn up as markets turn down for a few weeks.  If one wanted to play a short-term short, one could, however an equally good play is to keep cash at hand and take a swing long position once a nice ABC correction has played out in the broad indices. 

As for precious metals, the continued rise puts more weight on the bullish case for gold and silver, however the glaring non-confirmation in price from December still points to a longer-term bear market in the metals, and with deflationary forces due to crescendo again, that scenario may very well play out.  Despite that, the USD's correction looks underway, with minor potential for a rise above recent highs in the USD index.  A decline to below the 79.50 mark is a minimum corrective target, with the 78.60 mark being an ideal point to reset momentum and shake up short term psychology.

Next post I will show updated charts on the precious metals, Dow/S&P500, and any other assets currently of note.

Have a great Wednesday tomorrow!

Derek.

Wednesday, March 31, 2010

The Third (And Wildly Bullish) Scenario for Gold Stocks

In the article I wrote on March 22 ("When it Breaks, It's Going Somewhere in a Hurry"), I stated that there were two downside possibilities for the price of gold, with the bearish move to at least $950 being the most likely, and the move down to $650 being second most likely.

I also mentioned that there was a third possibility, and that the price of gold could move very rapidly to new highs somewhere around the $1325/oz level by the end of the year.

Needless to say, I received a flood of emails from gold bugs the world over, admonishing me for "in one breath saying that gold is going to make a multi-year low, and then in the other saying gold could make a record nominal high" to quote one of the least colorful ones.  Accusations of useless forecasting, throwing darts at a board and getting better results, even wasting people's article-perusing time were far from scarce.

Throw in the usual "you're crazy if you think gold is ever going below $1000 again because of [insert generic laundry list money printing/central bank/government/finance argument here]", and it made for a healthy batch of reading, and even an extension of the more offensive vocabulary.

In respone to that article, I posted my most recent one.  In it, I explained that I use Elliott Wave Theory as one of my primary methods of finding turning points in financial assets, and I showed two charts with the most likely wave counts for the HUI Index.  Both indicate a bearish situation, one with a probable 20% further loss in the HUI, and the other with a loss of 50% from here.

There is a third scenario, with some twitching and tweaking of wave structure and small bending of the Elliott Wave rules.  If one jostles enough there is a highly bullish potential wave count for the HUI (and the yellow metal itself in conjunction), which I present below.


I hope this explains to my readers why there is very little clear direction by way of gold right now - all three of these counts can work with gold at its current price level.  It is the moves out of this consolidation period that will determine the larger structure of the bull or bear market.

There are times for action and times to wait and see - if you are slow accumulator of physical metal and your end goal is to have as many ounces of gold as possible, I don't recommend making any major changes.  For traders, many are in the same boat and not committed to either side currently.  Perhaps the market will wait until the maximum number are committed to the fake move before reversing and making its real leg, up or down - we have witnessed this time and again in the long and short term, and with any number of assets.

Consolidation can only last for so long, and eventually we will see a break and follow-through of key support or resistance, indicating the larger leg in gold and where this market is taking us.

As to the very near future, although the correlation seems to be slackening of late, gold could run another $10- $20 up in light of a falling USD.  The initial stages of its larger degree move seem to be complete and the USD is due for a cool-down period before another major stab upwards.


Aside from the most-likely completed wave count leading to a near-term correction, the technicals are indicating a slower momentum against the wave 1 high, and we should see the turn of the last few days develop into something stretching out over at least a few weeks.


Stay sharp - these markets may feel complacent today but these are the times that many get snared in the trap of a huge and surprising move.

Derek Blain

As always, if anyone would like to send a comment, question, or suggestion, please feel free to email me at:
derek@investophoria.com

Friday, March 26, 2010

The Long Term HUI

One of the tools I use in forecasting is the Elliott Wave theory - this, coupled with indicators in sentiment and momentum, along with measuring the disconnect between fundamentals and reality, allow me to get a clearer picture of where the market is today and where it is most probably headed tomorrow.

The two highest probability wave counts for the HUI Index both indicate at least a near term decline in the price of gold stocks, both also indicate that gold should begin the largest bulk of its bull market within the next 24 months.


If the first scenario plays out (which in the context of a deflationary period is the most probable), the HUI will make a much lower-low than where it stands today.  If the second scenario plays out, the HUI will make a lower low, but will resume a bull market much sooner, and start from a much higher point.

Scenario I


Scenario II

 
As for the rest of the markets, the nearer term pictures is not as clear as the US Dollar and precious metals.  The move upward from March 2009, however, does not look impulsive unless one stretches to impose an impulsive structure onto them, and as such the primary degree trend still appears to be down.

How long it will take to hit the top and resume the long term bear market is not entirely clear, however with more retail investors piling onto this rally every day, the safest bet is less time than more.

Have a great weekend!

Derek Blain

Thursday, March 25, 2010

Waning, Waning, Waning...

Markets spiked upward today right off the open and continued to push higher, while a look at the underlying foundation shows cracks galore.

Gold has hardly rebounded off its move lower yesterday, trading a relatively tight range today, searching for its next move.  The odds are still much higher that the next move in the metals is a downward one, coupled with another small surge in the USD to finish off this first leg of the USD mid-term bull market.

The strength of recent rallies is waning fast, as indicated by the new highs on the broader NYSE versus the S&P500 index.

Every time we have seen this particul pattern play out in the past, the subsequent declines have been at least moderate, the most recent one bieing in January and shaving 8% off the index's value in less than 4 weeks.  The declines have also been getting larger, just as the divergence and underlying momentum has.  Can I say for sure that this one is "the big one"?  Absoulely not - the probability was higher in January where the actual price movement was a highly terminal one coinciding with the end of long-term rallies.

Still, a new low could be made in the broad indexes over the next 2 months, on the back of dollar strength and this next development:  China and the majority of asian stocks seem about ready to start another good-sized move down, which could pull much of the world markets along for at least part of the ride with it.  China is going to have its own probmes in the very near future (surplus cash or not, anyone who argues that every dollar of the Chinese government's investments are not at least partially malinvested needs to pick up a copy of Human Action  by L. von Mises and tell me they agree with that presumption after a historical examination of the success of any form of government spending), with the possibility of a strong deflationary period to correct many economic maladies.  This could be a good buying time for the RMB, especially relative to so-called "commodity currencies", many of which are also looking fairly terminal and ready for depreciated optimism relative to the USD.


The US markets are due for either a several percent correction or a longer period of sideways consolidation to build up momentum.  We will see what impact the rising dollar (its pull on stocks seems to be minimizing) and falling Asian markets have on North American soil.

Keep your heads up out there.

Derek.

P.S. the CFTC meetings are today and, much to the surprise of many avid gold investors who emailed me over the past few days, gold has not jumped $50.00 in price at the mere thought of short-covering.  If restrictions are put in place they will take some time to be enacted, and furthermore, according to historical market psychology, they will be put in around a time that should mark a long-term bottom in gold prices, and will make an excellent reinforcing indicator to start accumulating larger quantities of physical metal.


END OF DAY UPDATE

Today's rapid push back down in the broad markets form a potential kangaroo-tail point for the markets to reverse down over the next several days.  Initial support is at 10,700, with 10,450 - 10,525 acting as an ideal retracement point.  There should be one more push upward once this correction is complete, to mark a terminal pattern in the rise from March 2009.  However, the impulsiveness and breadth of this decline are extremely important for measuring the mid-term direction of the market, as the commodities, precious metals, and also the Asian markets have turned down and made lower highs.  

This is a major non-confirmation when taken in the context of explosive credit growth which led to virtually every market topping at roughly the same time in 2007 (within months) and the CRB index following very shortly afterwards - once they all turned down decisively, the major bulk of the bear market move was underway.

Although it still appears that the bias once this correction is over will be to the upside, we will have more information once it is underway to see whether this is just a small turnback to rattle the bulls, a sideways consolidation to build momentum for another surge, or the start of something bigger to the downside.